I am proud of yet another accomplishment I made at Mozilla. I created an infographic.
What’s an infographic I hear a few of you ask? I asked the same thing yesterday. An infographic is a marketing image that shows data or a process. It’s used to get a complex idea across quickly, easily, and visually.
The first step in my infographic-making process involved googling and finding videos on Lynda.com and Youtube. These videos led me to canva.com, an excellent free site for making infographics.
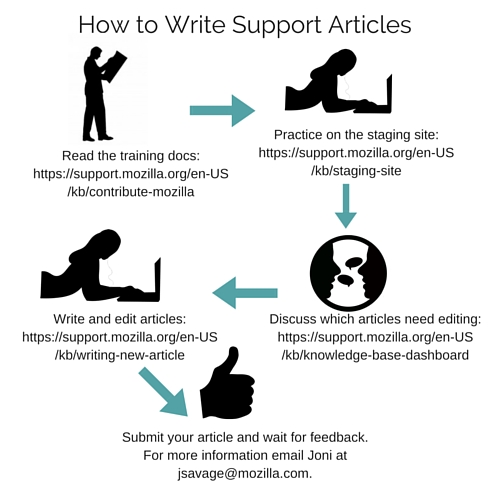
I knew that I wanted to show new Mozillians the basic process of writing support articles. After a bit of experimentation with arrows, silhouette images, and text, I came up with this. I’m proud of it as it’s my first major graphic design piece.